 Delhi figures among the world’s top-10 most expensive locations for premium office rents, according to JLL’s latest report, and Mumbai in the top-20.
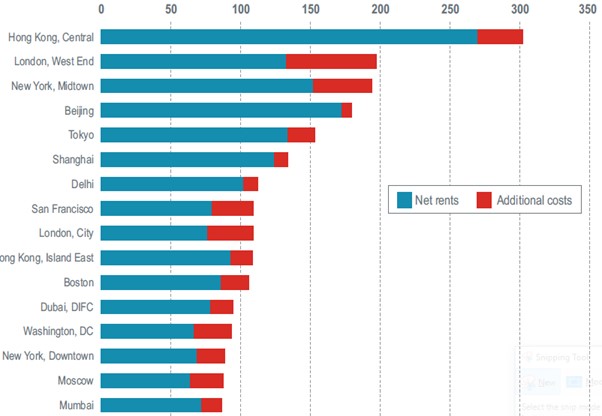
The findings reveal that the most expensive premium office rent in the world is in Hong Kong, followed by London, New York, Beijing, Tokyo, Shanghai, Delhi, San Francisco and London.
Mumbai rentals are higher than cities like Los Angeles, Singapore, Paris, Seoul, Sydney, Frankfurt, Chicago and Toronto.
Regionally, cities across Asia-Pacific are home to the world’s most expensive premium office space at an average of USD 111 per square foot per year, which is higher than the Americas (USD 85 psft per year) and EMEA (USD 78 psft per year).
Hong Kong’s Central continues to be the world’s most expensive office sub-market globally. Most striking is the differential that has emerged between Hong Kong and the next most expensive cities, with costs for premium office space now in excess of 50 percent greater than either London or New York.
At USD ~300 psft per year, total rents here set corporate occupiers back by close to 70% more than for comparable buildings in either New York’s Midtown or London’s West End.
While six sub-markets from Asia figure in the top-10, economic diversity also means that it offers some of the world’s most competitively priced premium space, with Kuala Lumpur, Manila and Bangkok comprising the top three most affordable premium office locations globally.
About the PORT:
In this third edition of JLL’s Premium Office Rent Tracker (PORT), like-for-like occupation costs across 54 major office markets in 46 cities are compared. The 2017 edition adds a further 19 markets from 2016, when 35 major markets in 31 cities of differing function and evolution were included.
Premium office rents refer to the ‘top achievable’ in units over 10,000 square feet in the premium building in the premier office district of each city. In tall buildings, the middle zone is used as the benchmark.
You may like to read
—————————————————
————————————————
The report excludes rents that represent a premium level paid for a small quantity of space or highly prestigious units where a significant premium applies.
Total occupancy costs are calculated by combining the net effective rent with additional costs (e.g. service charges, taxes). The regional average is calculated based on all the total occupancy costs for the 20 tracked markets in Asia Pacific.