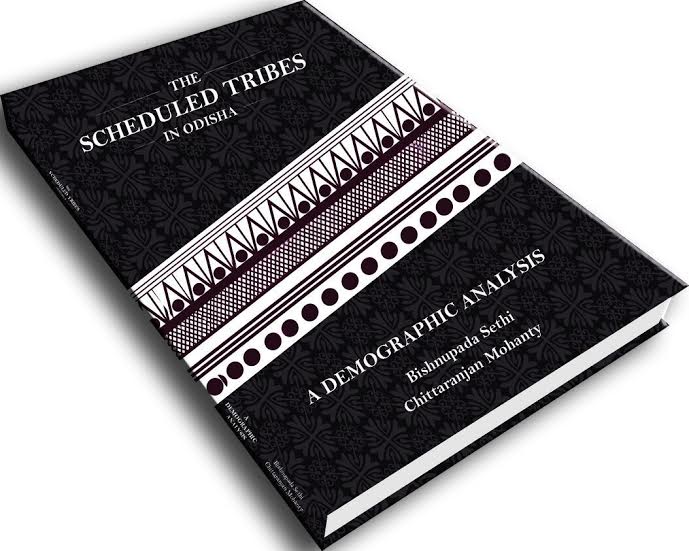
The Scheduled Tribes in Odisha-A Demographic Analysis
The book has tried to reveal the status of different Scheduled Tribes in Odisha with comparison with state averages.
Despite the sincere and concerted efforts by the Central and Odisha government for the overall development of the Scheduled Tribes in Odisha, they are still far behind in terms of standard development parameters.
It is a well-known fact that their participation rate in developmental activities is very low due to lack of education and other skills.
Is there any change in educational level as well as other social indicators of Scheduled Tribes in Odisha?
This is one of the main purposes underlying of the book “The Scheduled Tribes in Odisha” written by Bishnupada Sethi and Chittaranjan Mohanty based on the data collected from different Censuses.
The book has six chapters and discusses details about growth of Scheduled Tribes in Odisha, access to basic amenities, education and fertility rate, sex ratio among Tribes in different districts and present status.

Bishnupada Sethi
Who are the Scheduled Tribes and how is it defined in the Indian Constitution has been discussed in Chapter I. The term ‘Scheduled Tribes’ as the name denote are the castes or tribes listed in Schedules in the orders by the President of India.
As per the Article 341 and 342 of the Constitution, the President of India is empowered to specify the lists of Scheduled Castes and Scheduled Tribes for each State and Union Territory.
The English term ‘Tribe’ comes from the Latin word ‘Tribus’, designating a particular kind of social and political organization existing in all these societies.
In the Indian context, the term ‘Tribe’ refers to the ‘indigenous Janas’. They are commonly designated as Adivasi’ (original Settlers), Girijan (Hill dwellers), ‘Vanya Jati’ (Forest Castes), Adima Jati’ (Primitive Catse), ‘Jana jati’ (folk communities), ‘Anusuchit Janjati’ ‘Schduled Tribes’ and by their respective tribal appellations.
The inclusion of different categories of people in this group during different censuses is discussed in chapter II. There were 42 tribes in the state for whom data were collected during 1951 Census, and the number has increased to 62 tribes after the changes in 1956.
Though, there were changes in the names in the year of 1976 and 2003 as per the SC/ST order (Amendment Act 19176-108 and Amendment Act 2002 – 10), the number of Scheduled Tribes have not changed and remained as 62. Only new sub-tribes have been added to the main tribes.
According 2011 census, Odisha has got 22.85% population as ST. During the decade of 2001-2011, the growth rate of Scheduled Tribe population is 17.75% which is more than the growth rate of total population of the state e.g., 14.05%.
Access to different assets and different type of household amenities indicate the economic standards of the particular group.
The house listing and housing Census has immense utility as it provides compressive data on the conditions of human settlements, housing deficit and consequently housing requirements and formulation of housing policies, which is discussed in Chapter III.
This chapter analyzed the data collected in 2001 and 2011 Census. Though the data on housing were not collected systematically before 2001 census, the book has attempted to examine the housing standard based on 1991 Census.
According to 1991 Census, 24.29% of households belong to Scheduled Tribes, where 95.73% of households are residing in their own house and 90.21% in case of the total population.
However, Scheduled Tribes have less number of rooms compared to others. 40.28% of ST has only 1 dwelling room while it is 29.45% in case of total households.
The information on drinking water indicates that 8.96% of total households have access to tap water whereas it is only 3.88% in case of Scheduled Tribe.
It is important to note that 11.97% of the ST households depend on the river/ canal for their drinking water. The situation is very worse in case of access to electricity and latrine.
Only 6.91% of ST households have access to electricity and 1.60 % to latrine facilities. It is well known that Tribes have better access to forest and so 92.40 % of households use firewood for cooking whereas it is 73% in case of total households.
There was a major shift in the approach of data collection in 2001 Census and also in 2011 due to recommendations of UN.
The standard of living in respect of having good houses has improved in 2011 compared to 2001 in both cases.
Among STs, households having good condition houses has increased from 17.11% in 2001 to 19.10% in 2011, but it is lower than the total households in the state (25.50% to 29.5%).
The use of Grass/Thatch/Bamboo/Wood for household roof has been decreasing in 2011 compared to 2001 Census, while access to concrete household is increasing.
The concrete household has increased from 13.28% in 2001 to 23.5% in 2011 among all household.
 However, it is only increase of 2 points from 2.31% to 4.70 % in case of ST. The use of mud for household floor plays a major role among both total and ST households though it is decreasing compared to 2001 census.
It indicated from the materials used for roof, wall and floor that the tribal households are more deprived compared to others in the state.
Information on household size indicates that 26.37% of total households have average 6-8 members in 2001 which is further decreased to 20.90% in 2011. Similarly, in case of ST, it decreased from 25.77% in 2001 to 24.40 % in 2011.
This shows that ST households have higher number of birth rate. Access to safe drinking water plays an important role in improving health conditions.
It is observed that hand pump is the major source of drinking water both in case of ST and total households. 43% of ST households and 41.40% of total households depends on it.
The use of hand pump and tap water for drinking is increasing in 2011 compared to 2001 census while other source of drinking i.e. river/bore well/spring/lake/etc. is declining.
Kerosene is the main source of lighting among both total households (43%) and ST (82.30%) in 2011, though it decreased compared to 2001 census.
The use of electricity is higher among total households compared to ST households.
Similarly, the access to latrine in the house premise has increased in both cases, but it is more among total households compared to ST.
Though the use of firewood has been decreasing for cooking, it is still a major source of cooking both among total and Scheduled Tribes. 65% of total households and 87.9% ST households depend on it for cooking as per the 2011 census.
On the other hand, the use of LPG has increased from 5.22% to 9.8% among total households.
 However, it very negligible among tribal population (only 1.6% in 2011). Access to banking facilities have increased from 24.21% in 2011 to 45% in 2011 among total households while it is only 15.81% and 35% among tribals. Similarly, the ownership of TV also has increased among both.
Having discussed the household amenities and access to basic assets in previous chapter, Chapter IV discussed about the population growth, sex ratio, literacy rate and also work participation rate among Scheduled Tribe with comparison to total population in the state.
The growth rate of Scheduled Tribe is higher than the total population growth rate in the period of 2001-2011.
The highest growth rate (42.96%) of Scheduled Tribe is observed during 1961 compared to the Census 1951, while it was 19.82% in case of total population. The high growth rate is observed due to inclusion of various groups into the Scheduled Tribe.
Statistics on literacy rate shows that only 43.96% of Scheduled Tribe population is literate while it is 67.71% in case of total population. Male population is more literate than female in both cases.
Though literacy rate is higher among total population compared to Scheduled Tribe population, the gap is declining while looking at data in different census –13.99% increase in literacy during the period 1991-2001 among total population and 15.06% in case of STs.
Similarly, 14.87 points increase in literacy rate during the 2001-2011 among ST is noticed, it is only 7.79 points in case of total population.
Though the literacy rate is increasing among STs, the education level is very low and limited up to primary and middle level education. Very few STs are attending higher education or any technical education.
According to 2011 census only 1.54% of literate ST are graduate or above and it is worse in case of technical education.
Further, this chapter deals with work participation rate and observed that the work participation rate among total population had increased from 37.53% in 1991 to 38.79% in 2001, while it decreased in case of Scheduled Tribe from 49.36% to 48.99%.
According 2011 census, the work participation has increased in both cases – 41.79% in case of total population and 49.73% among the Scheduled Tribe.
The increasing trend is also observed among male as well as females for both total population and Scheduled Tribe Population. Among the district, higher work participation is found to be in Debagarh (52.94%) and the lowest in Jajpur (30.22%).
The highest work participation among ST population is recorded in Bargarh district (55.33%) and the lowest also recorded in Jajpur (34.99%).
Coming to the work participation in particular activities, it revealed that agriculture still plays a major role for livelihood improvement for more than 60% of population.
However, the agricultural laborer has been increasing while the actual cultivator is declining.
Statistics on gender classification indicates that male cultivators are more than the male agricultural laborer in both total population and Scheduled Tribe, while in case female, agricultural laborer are more than the cultivators.
Information on population involved in household industries reflects that according to 2011 census the percentage of household industry workers to total workers is 4.46% in case of total population and it is 3.41% in case of Scheduled Tribe population, which has declined compared to earlier census.
Further, it is observed that females are more involved in these household industries.
Age of the particular group determines the strength of the economy. The book revealed that Scheduled tribe population is concentrated below the age of 14 years than the total population.
35% of Scheduled Tribe population are below 14 years, while it is 28% in case of total population.
It is observed that 61.43% of the total population is reported in the age group of 15-59, while it is slightly low in case of Scheduled Tribe population (56.67%).
Similar trend is observed in case of male and female in both total population and Scheduled Tribe.
Age specific sex ratio plays an important role in different types of planning in the field of health, education etc.
Highest sex ratio of 1022 is recorded in the age group 20-24 years in total population whereas in case of ST population the highest sex ratio of 1323 is recorded in the age group 75-79 years.
Census 2011 has for the first time collected the fertility rate among married women. It is observed that 14.27% of the ever married women have never given any child birth, however, it is little high in case of Scheduled Tribe (16.18%).
Further, it is observed that out of total ever married women, 16.16% of these have no surviving child, while it is 19.22% in case of Scheduled Tribe.
The statistics on concentration of population indicates that Ganjam is the most populous district which constitutes 8.41% of state’s population followed by Cuttack and Mayrubanj.
The least populous district is Debagarh. Coming to the ST, Mayurbhanj ranks first where 15.43% of state’s ST population lives in this district followed by Sundargarh (11.08%).
It is observed that more than fifty percent of tribal population resides in six districts namely Mayurbhanj (115.43%), Sundargarh (11.8%), Kendujhar (8.54%), Korput (7.27%), Nabarangpur (7.10) and Rayagada (5.65%) as per the 2011 Census.
In case of sex ratio, Rayagada has highest sex ratio both among total population (2051) and ST (1092). The lowest sex ratio among ST population is observed in Jagatsingpur (860) and Nayagarh for total population (915).
The child sex ratio among total population is found to be the highest in Nabarangpur (998 according to 2011 census), while Nayagarh has lowest sex ratio (855 in 2011).
Among ST population, high child sex ratio is observed in Puri (1198 in 2011 Census) and the lowest is observed in Jagatsingpur (859 in 2011 census).
High literacy rate among ST population is found in Puri (74.62%) and lowest in Malkangiri district (35.23%).
Chapter V presents the status of the particular Scheduled Tribe population in state. There were 16 tribes those have presence in all 30 districts of the state.
It is observed 12 tribes in term of population constitute more than 70% of the total tribal population in each census. The highest population is recorded in Khond Tribe in all the Censuses from 1961 to 2011.
Gond tribe was in second position till 2001 Census but Santal tribe which had occupied 3rd position got upgraded to 2nd position in 2011 census.
It is important to note that Baiga had only 52 people in 1961 which has increased to 522 in 2011. However, Chenchu Tribe population has reduced from 52 in 1961 to 13 in 2011. Effort should be made to revive this community.
Statistics on growth rate of particular tribe indicate that there are 10 tribes where growth rate is more than 100%. It is important to note that Bagata and Bhakta Tribe had negative growth rate of 82.59% during 1961-71.
However, it had the highest growth of 894.68% during 1971-1981. In 1981-1991, the highest growth rate (727.66%) was recorded among Baiga Tribe.
However, Kol Tribe has occupied high growth during 1991-2001. Tharua Tribe occupied first position in terms of growth rate of 1986.31% during 2001-2011, which had negative growth rate of -71.60% during 1991-2001. During this period, 15 tribes had experienced negative population growth rate.
This result indicated there is high fluctuation in population growth rate among different Tribes.
The efforts should be made to identify the reason for high fluctuation in population growth rate.
Information on sex ratio shows that Chenchu Tribes have the highest sex ratio (1167), while Mankiria, Mankirdia, Mankidi tribe have lowest sex ratio (942) in 2011.
It is also reported that there are 11 tribes those have low sex ratio (below 1000). In case of literacy rate in 2011 census, the highest literacy rate (78.88%) is recorded in Kulis tribes and lowest of 21.14% recorded in Mankidia tribes.
The Kulis Tribes have high literacy rate in all censuses since 1981. Further, only 2 tribes have less 30% of literacy rate. Literacy trend among tribe has shown increasing trend.
The work participation rate was higher among Birhor Tribe (50.02%) according to 1971 Census.
However, in 2001 Jatapu Tribe has the highest work participation (57.36%). Chenchu has the highest work participation (69.23%) in 2011, whereas the lowest work participation was found among Kharwar tribe.
In 2011, there were 29 tribes those have low level of work participation (even lower than the state average), while other 31 have above state level of work participation.
There were two tribes those have more than 60% of work participation.
Having discussed about different tribes in Odisha in earlier, chapter VI examined the present status of Primitive Tribes of Odisha.
There are 13 Primitive Tribes groups in Odisha –Birhor, Bondo, Didayi, Dongaria-Kandha, Juang, Kharia, Ktia kandha, Lanjia Saora, Lodha, Mankirdia, Paudi Bhuyan, Saora and Chuktia Bhunjia.
However, Census 2011 has reported the population of 11 Primitive Tribe groups. The highest growth rate of 64.10% was recorded among Bhunjia Tribe during 1991-2001, while Mankirdia Tribe has highest population growth of 111.62% during 2001-2011.
It is also revealed that population growth rate has been fluctuating among different tribes from decade to decade. This could be due to their nomadic nature.
Statistics on sex ratio shows that in 2011 Census, Bondo Poraja Tribe has the highest sex ratio (1158), while Mankirdia Tribe has the lowest sex ratio (942).
The child sex ratio was observed to be higher than 1000 among all Primitive Tribes except Mankirdia and Bondo Poraja as per the 1991 census.
However, in 2011 only three tribes have more than 1000 sex ratio. It is important to note that Bondo Poraja has 947 as sex ratio in 1991. It has increased to 1048 in 2011.
Though the literacy rate among primitive tribes is increasing over the years, it is below the state average. In 2011, the highest literacy rate was recorded among Bhuiya Tribe (63.14) and the lowest is observed among Mankirdia Tribe (21.14%).
The literacy rate among the Mankirdia Tribe has been increasing since 1991. Coming to the work participation rate, it is found to be highest among Bhunjia Tribe (57.49%), while the lowest among Bhuyia Tribe (47.97%).
It is important to note that, the tribe those have high literacy rate have low level of work participation. It needs further investigation to find the reason for the low level of participation.
The statistics on the concentration of particular tribe shows that more concentration of Bhuiya tribe is reported in Kendujhar district followed by Sundargarh.
The Birhor Tribe is mainly noticed in Sambalpur district followed by Sundargarh district. Bondo Paroja Tribe those are more primitive are found to be more concentrated in Malkangiri district followed by Nabarangpur, while Khond Tribes dominates in Rayagada district followed by Kandhamal district.
The Saora primitive tribes are more concentrated in Gajpati district followed by Bargarh district.
It is observed the education level is increasing among the Tribes and getting closer to the state average.
Work participation among female is increasing among both ST and total population, which is a good sign of women empowerment. Though the sex ratio was declining up to 2001, it has started increasing in 2011.
It is interesting to know that population growth rate of some tribes is declining while it is increasing among others. So it needs further investigation on these issues.
The book has tried to reveal the status of different Scheduled Tribes in Odisha with comparison with state averages.
It is very informative and can serve as an important resource for research scholars working on Tribal economy and for policymakers to improve the social status of particular Tribes in the State.
The book, 242 pages, has been published by India Book Bazar, C/o- Imperial Edusystems Pvt. Ltd, Bhubaneswar, Hyderabad can be ordered online at www.odiabookbazar.com and www.amazon.in
 Braja Bandhu Swain, PhD
Scientist
International Livestock Research Institute (ILRI)
ICRISAT Campus, Hyderabad
India
[email protected]